

As a forensic analyst, I can often spend the majority of my day diving into SQLite databases looking for various forensic artifacts from mobile spyware cases. It could be looking for anomalies of data that has been cleaned up, researching potential IOCs, or device usage to determine how a device got compromised. I often joke that my favorite forensic tools are a terminal window and a database browser, and in reality - it's mostly true (give or take a few vibe-coded custom tools - don’t judge me.)
One of the databases I spend an inordinate amount of time in is iOS Powerlog databases. This is because it is available in an iOS sysdiagnose dump - something we work with every day here at iVerify. The Powerlogs database is a particularly large database with upwards of 700+ tables (this can vary depending on OS version, hardware, etc.) but it is also one of the most powerful datasets in that sysdiagnose dump. For more information on this database, see my presentations here at Objective by the Sea or Out of the Box.
Folks who are new to SQLite databases, just the number of tables this database has can be very intimidating - let alone performing analysis on its contents. In this blog, I’d like to offer up some of my favorite tips and tricks to analyze SQLite databases using one of my favorite tools, DB Browser for SQLite. I’ve chosen DB Browser because it is open source and is available across many platforms. This post will be slightly macOS focused (I’m unapologetically an Apple fan girl), so while hotkeys may be slightly different, DB Browser will generally work the same across platforms.
I wanted to get this blog out for our upcoming iOS Threat Hunting and Malware Analysis training at Black Hat in a couple weeks. Our students are sometimes introduced to SQLite databases and they don’t really know how to go about analyzing them, so perhaps these tips and tricks will make that easier!
Fonts and Cell Colorization
One of the first things I change when I install DB Browser on a new system is the look and feel of DB Browser. On first launch, you’ll see a bunch of windows already opened on the right-hand side. You can close all of these. You’ll want as much screen real estate as possible for analysis. You can always open them later using the View menu.
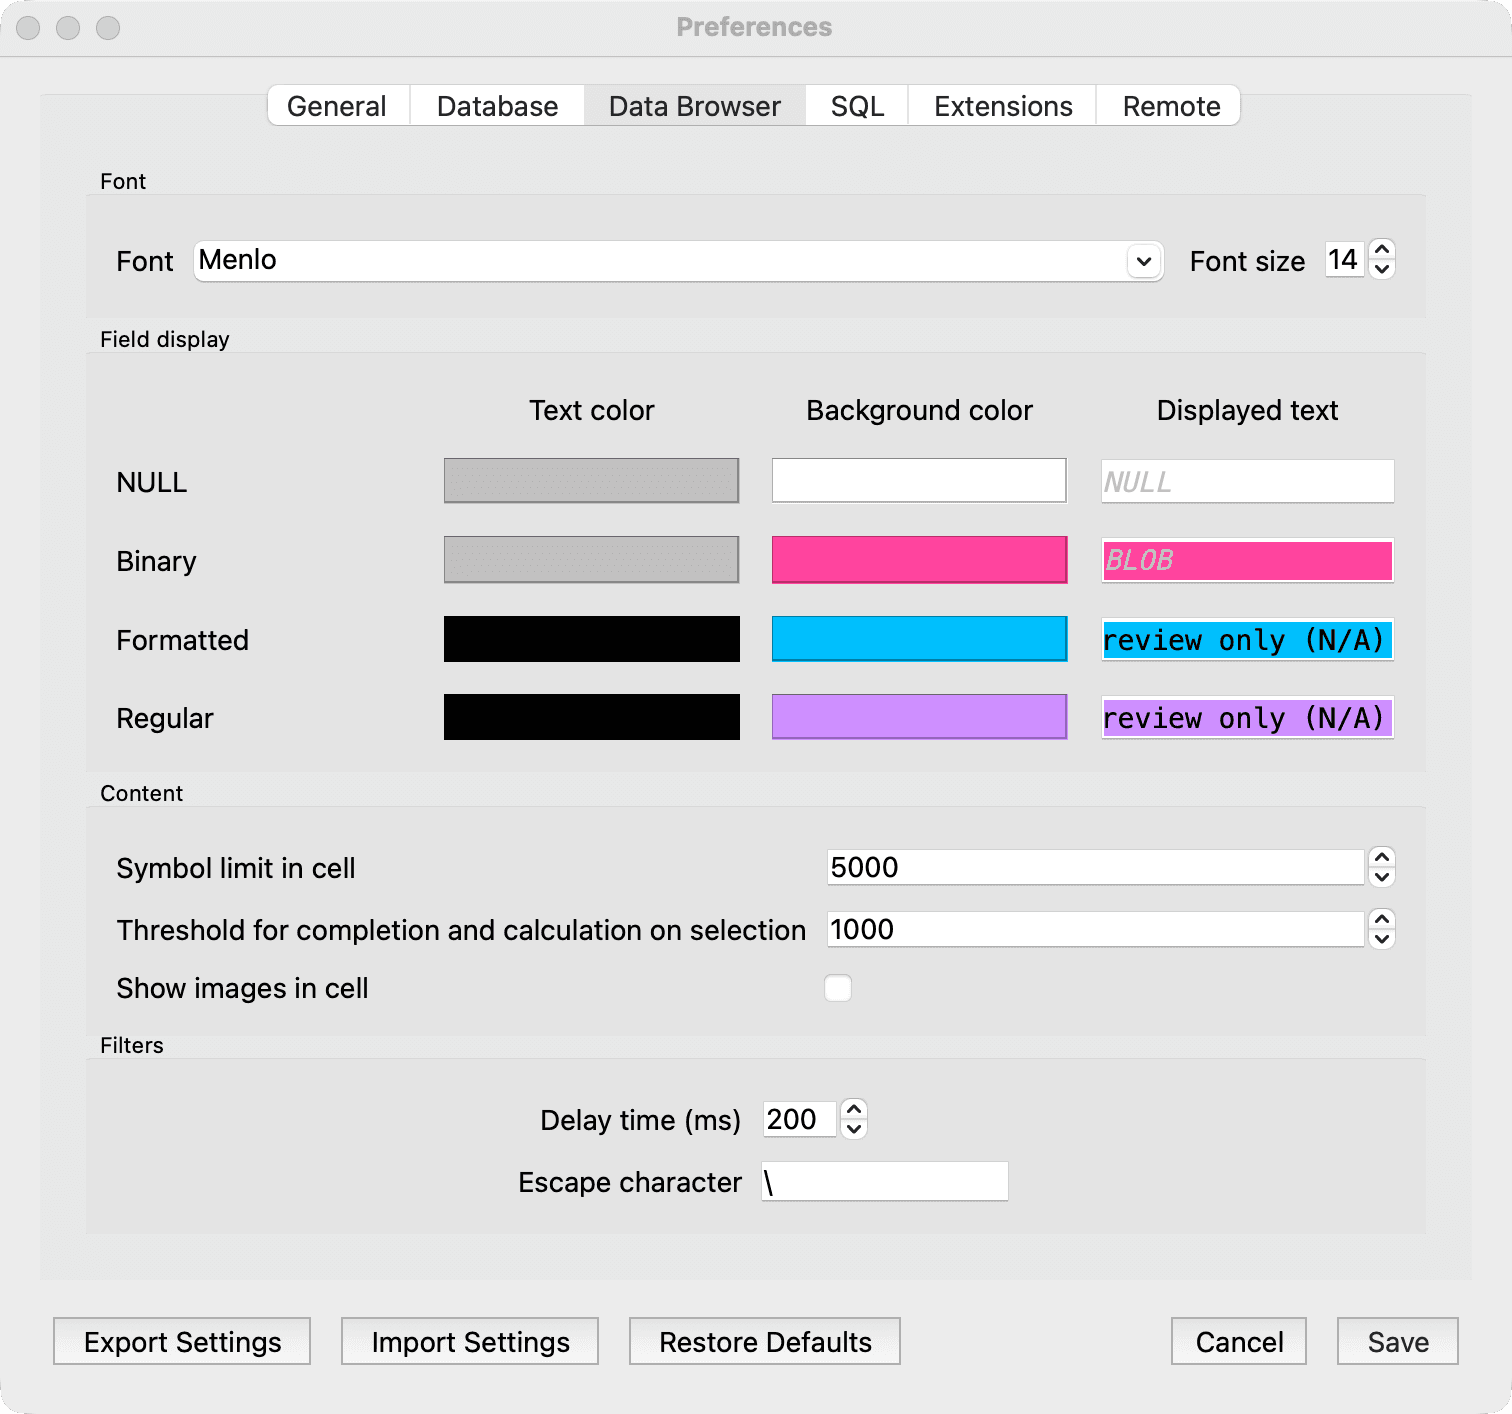
Next I open up the Preferences. Fonts can make a huge difference in how easy data can be read. While this is certainly a personal preference, I prefer a clean monospace font like Menlo versus the default American Typewriter. If you want to change the font to some of the classics like Papyrus or Comic Sans, you do you - there are many options available and I won’t judge. I also adjust the font size, something that seems to increase with every birthday. Note that font size and fonts are distributed across a few settings tabs so make sure to adjust all of them as needed.
The cell colorization may be one of my favorite settings to change. When I’m digging into large databases with hundreds of tables each with hundreds of columns, I need to quickly triage the data in each table. In my Preferences example below, I keep NULL entries as white, Binary BLOBs in hot pink, formatted cells in a bright blue, and Regular data in purple. You will see many examples of this colorization in my other tips.
Browsing Tables
When I’m reviewing an unknown database for the first time, I often peruse each table to get a sense of what type of data I can expect to find. This often helps determine which tables to create SQL queries on later on for my research needs.
Tables in DB Browser are best reviewed in the Browse Data tab. To review each table, you would need to select the table of interest in the drop down menu. This is fine for smaller databases, but with Powerlogs - you would likely get a hand cramp trying to do this for 700+ tables!
Instead, I like to use the fn+command+Up or Down Arrow Keys keyboard shortcut on macOS to quickly review each table. Other platform keyboard shortcuts can be found here. With this shortcut, you can quickly (relatively speaking) iterate through hundreds of tables to see what is available.

Timestamp Conversion
Many databases will use some sort of timestamp to organize its data. In forensics timestamps are extremely important to us to create timelines of events. While SQLite has capabilities for a variety of timestamp formats, we can usually expect to find an even mix of Mac Epoch (aka NSDate, Cocoa, CFAbsolute) or Unix Epoch timestamps in databases on iOS devices.
These can be easily converted in a SQL query, however sometimes I’m lazy and I just want to see human readable timestamps while triaging my table. We can use the internal conversion utilities to make these epoch values a bit more useful.
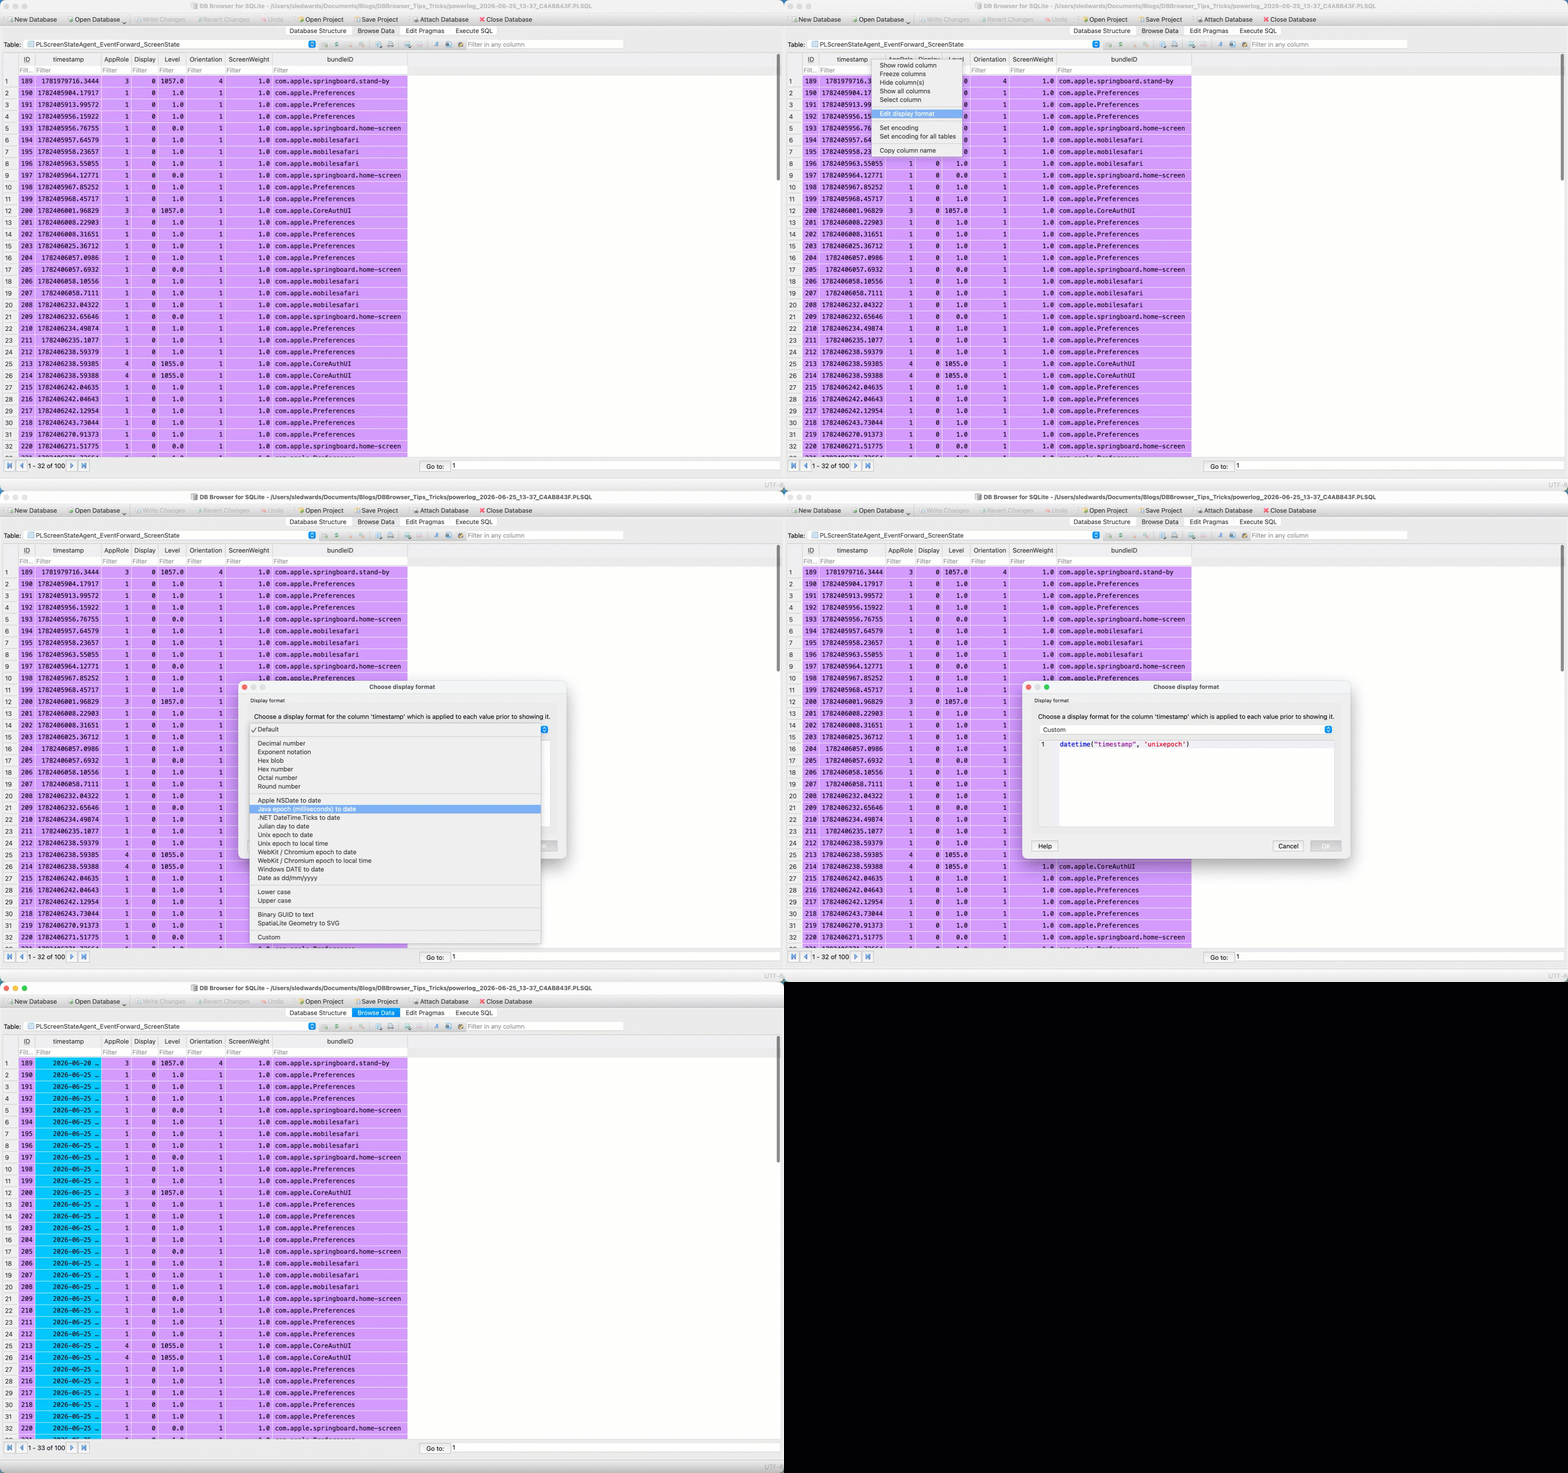
Selecting the column using a context-click, select Choose display format and select one of the following options for the appropriate timestamp. You may also notice the cell background color changes to show its been converted. This is a good example of one of my tips above.
Mac Epoch (seconds starting on January 1, 2001 00:00:00 UTC)
Apple NSDate to date (UTC)
Unix Epoch (seconds starting on January 1, 1970 00:00:00 UTC)
Unix epoch to date (UTC)
Unix epoch to local time (local system time zone)
While I’m a UTC or GTFO kind of gal, I find this one to be very useful for testing on your own data without having to do time zone math.
Worth an honorary mention: The Powerlog database uses Unix epoch timestamp, however it also uses a time offset so some folks may see a wildly different number depending on that offset so this conversion method may not work. You can find more information about this offset in my Power of Powerlogs presentation. It can be obnoxious if you are not prepared for it, I’ve only ever seen this time offset in Powerlogs, other databases should be ok.
Open Multiple DB Browser Instances
At any given moment I likely have a dock that looks like the example below. I’m often pivoting between various databases across different devices. If you happen to double-click open a database expecting it to open in an additional window, you’ll find it does not open in a new DB Browser window and instead replaces the database within that window.

On macOS, I use the "open" command to facilitate opening multiple instances, or more directly open up databases that have a non-conventional file extensions (like Powerlogs with its *.PLSQL extension.)
While I have become used to typing out this manually each time (yay muscle memory), a colleague of mine prefers to use a command alias. You can use the following commands to create an alias named db to launch a new window of DB Browser.
Open your .zshrc file using nano.
Copy this command and save it.
Reload the shell source to implement the alias.
After the alias has been created you can now open the database by simply using the db alias.
Filters & Conditional Highlighting
Perhaps you are again too lazy to create a SQL query to perform a search or filter. There are multiple ways to search the contents of a table.
One method is to use the Filter in any column search. This will search all columns in the current table. (And before you ask, because they always do - no, I do not know of a GUI based method to search ALL tables. For what it's worth, I will use sqlite3 to dump the database and grep instead).
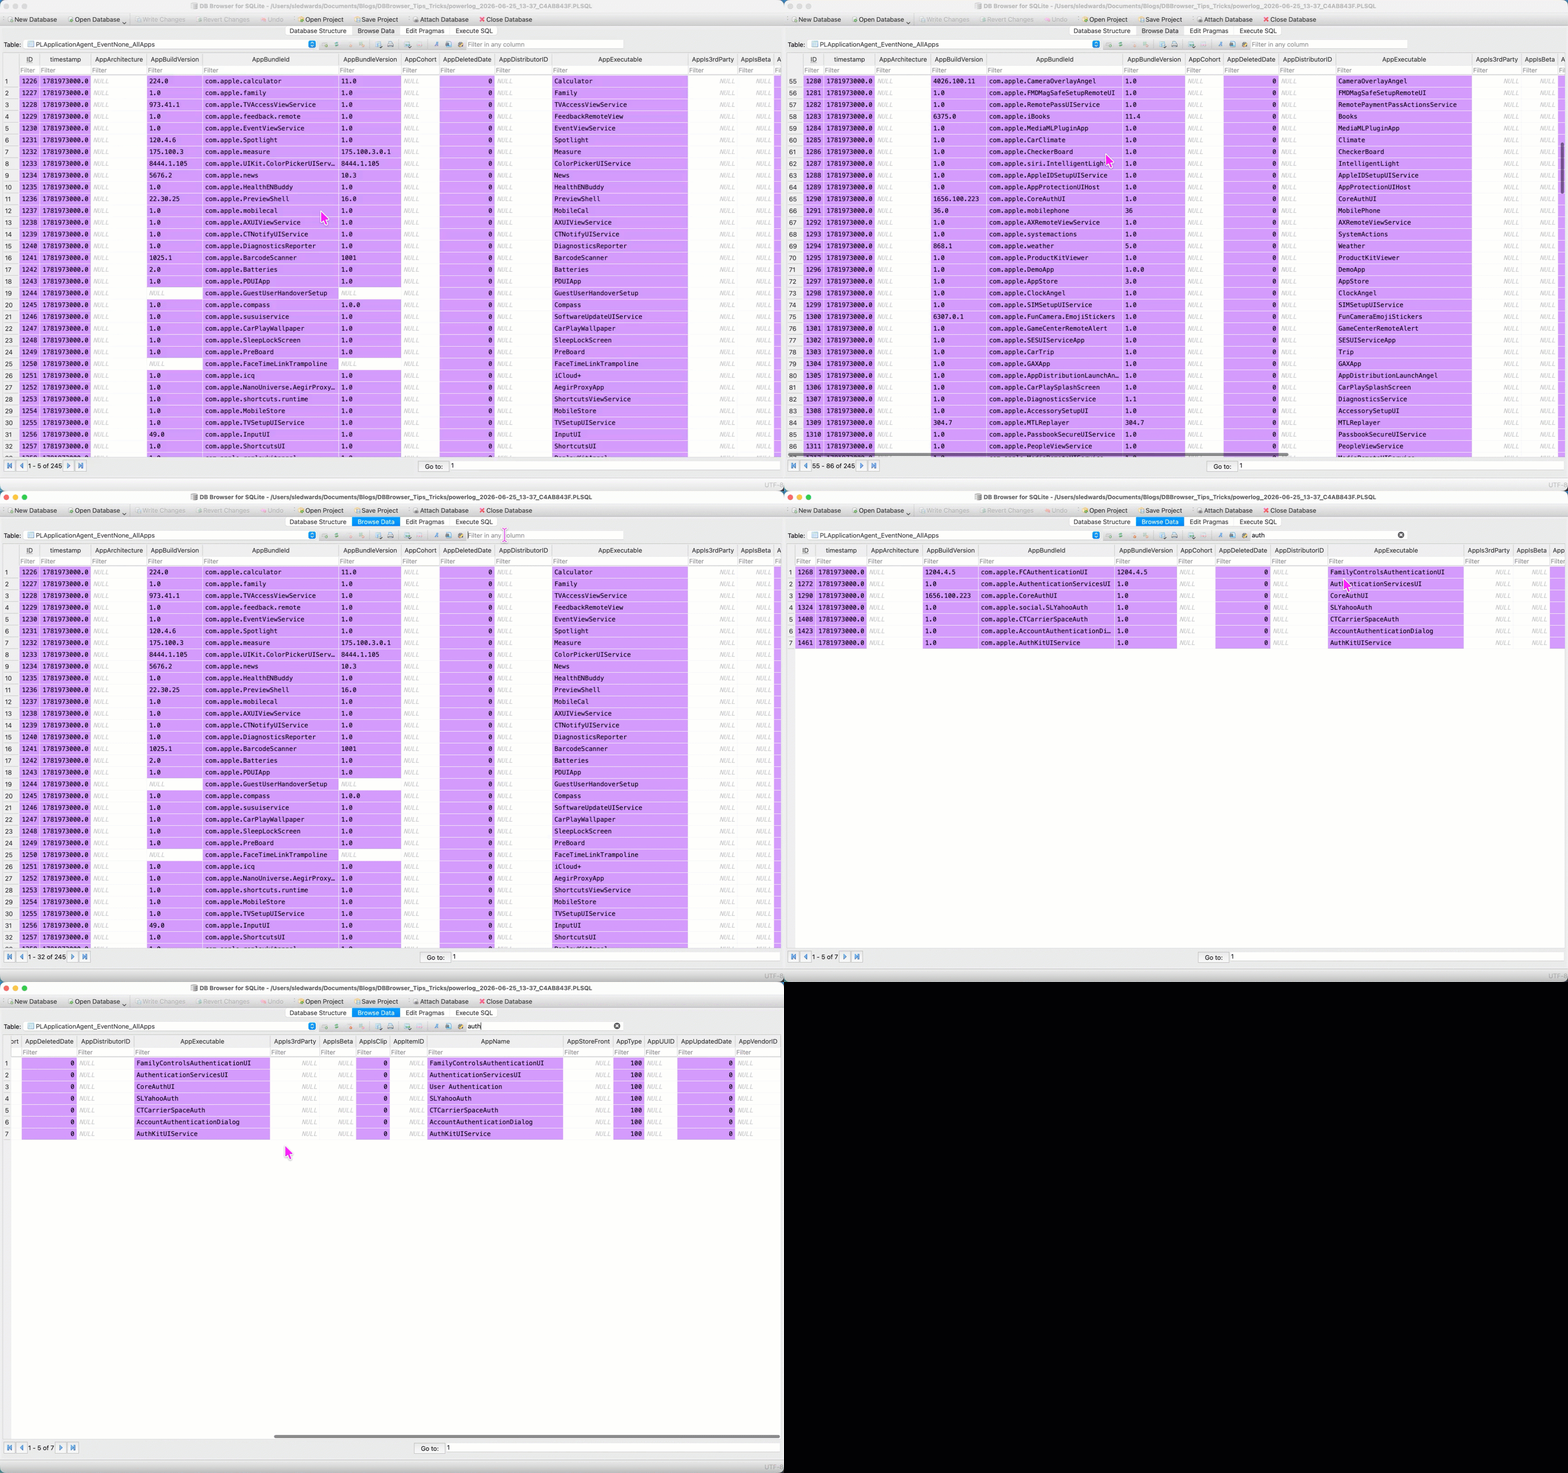
You can be more specific by using the individual column filters. These can be combined using multiple columns or you can set specific filter expressions by doing a context-click on the filter area.
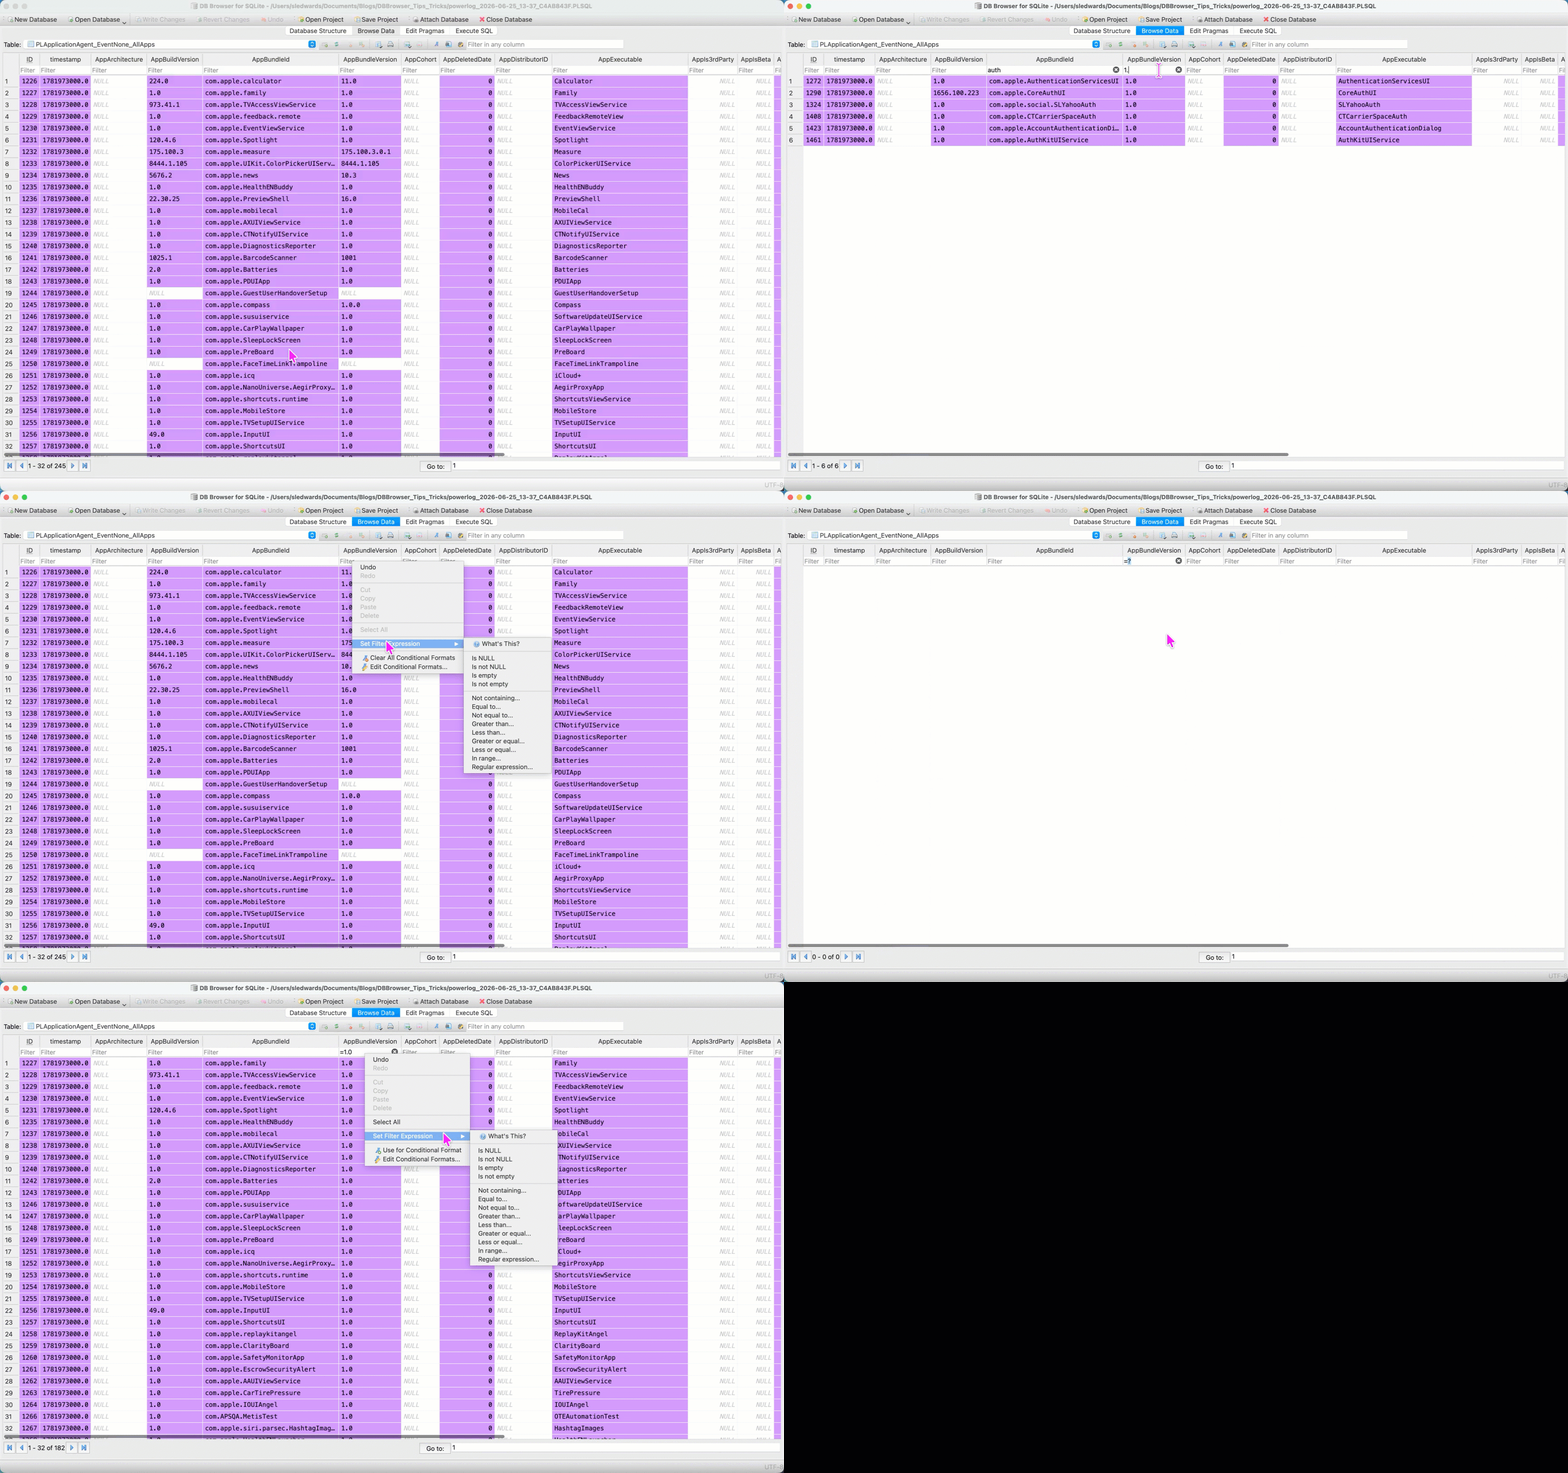
Instead of filtering the data you may want to look within context. I find conditional formatting may be useful to colorize or otherwise highlight certain pieces of information that match a certain condition.

Plots
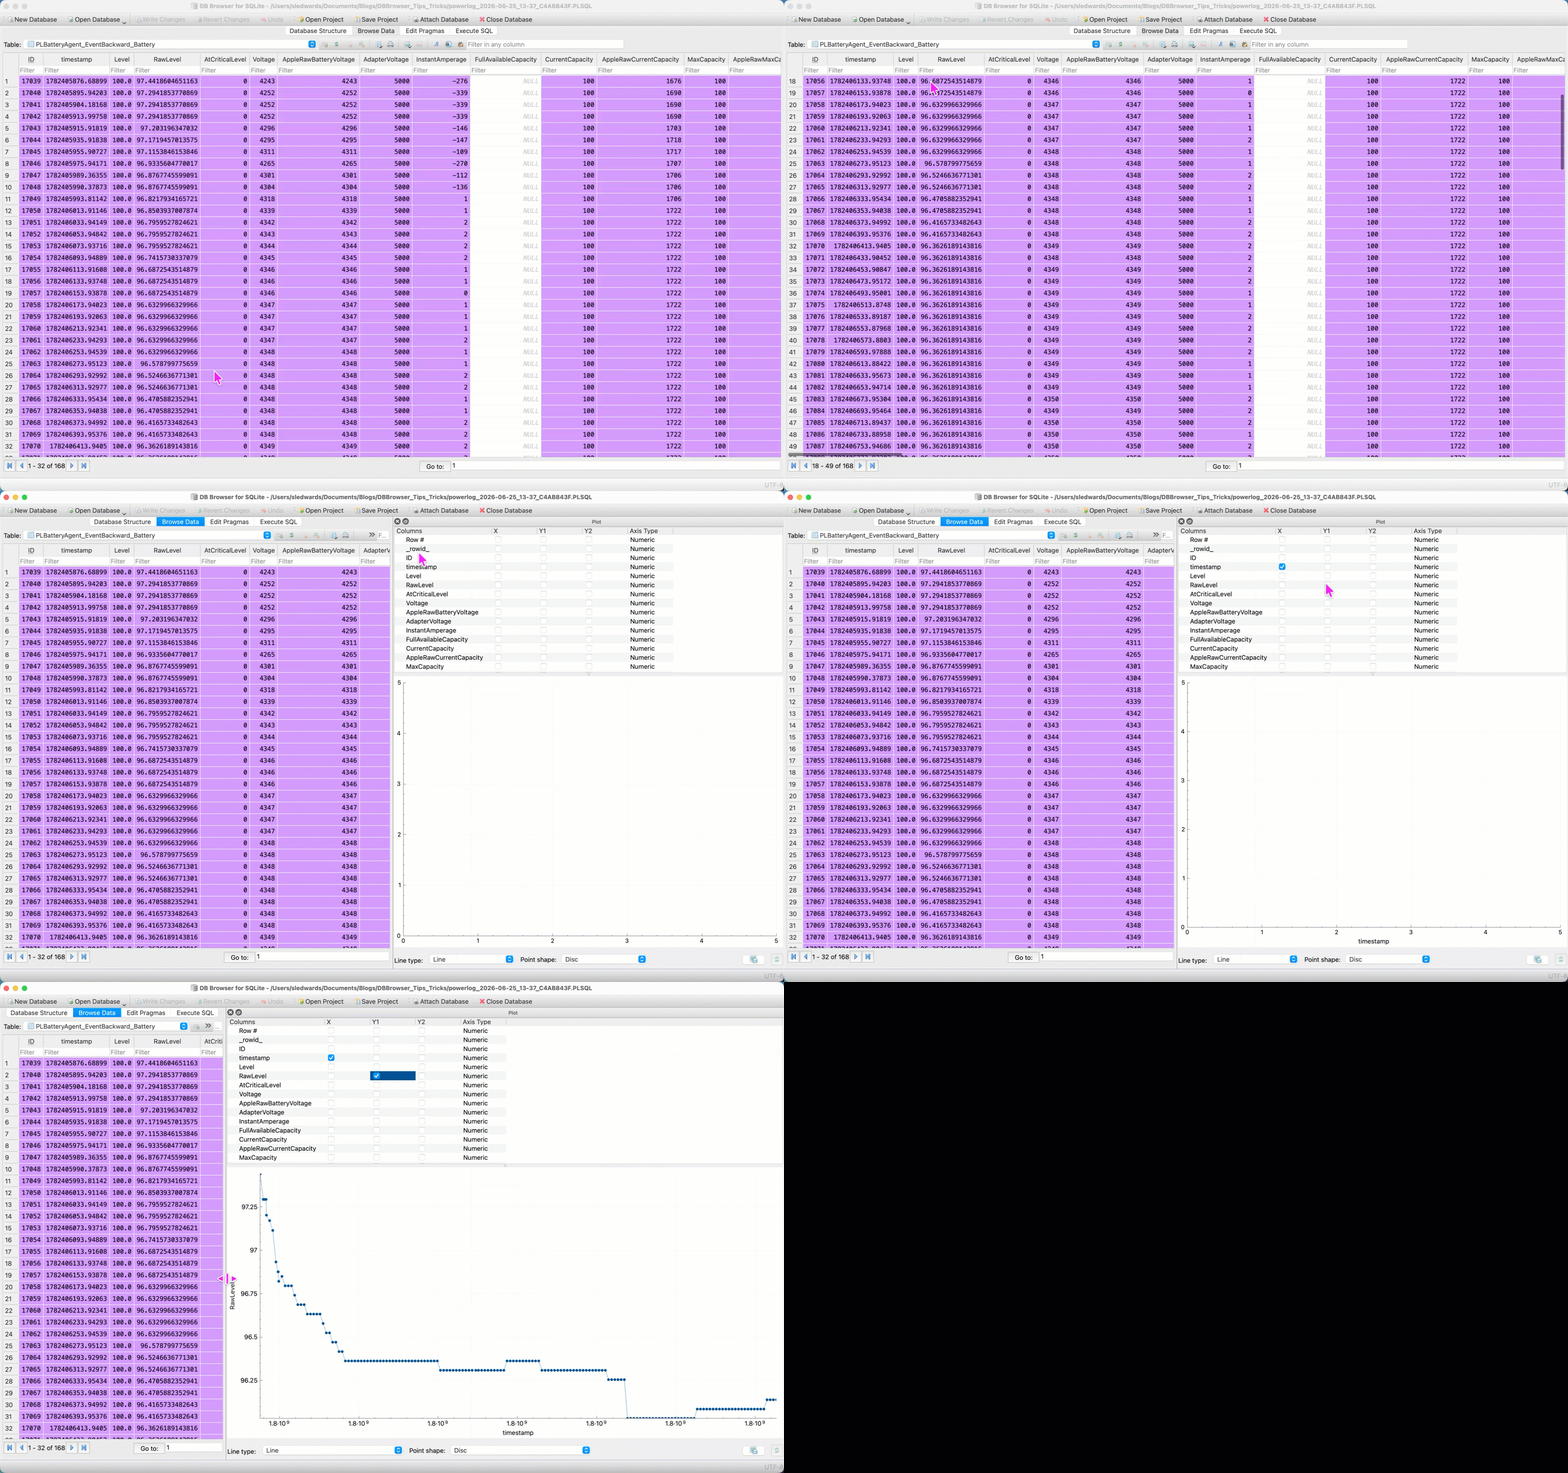
Plotting data out can reveal certain patterns such as battery levels of an iOS device. DB Browser has an internal plot view available in the View | Plot menu that makes viewing this data useful and can be exported out in a variety of image formats.
Browse Table Views
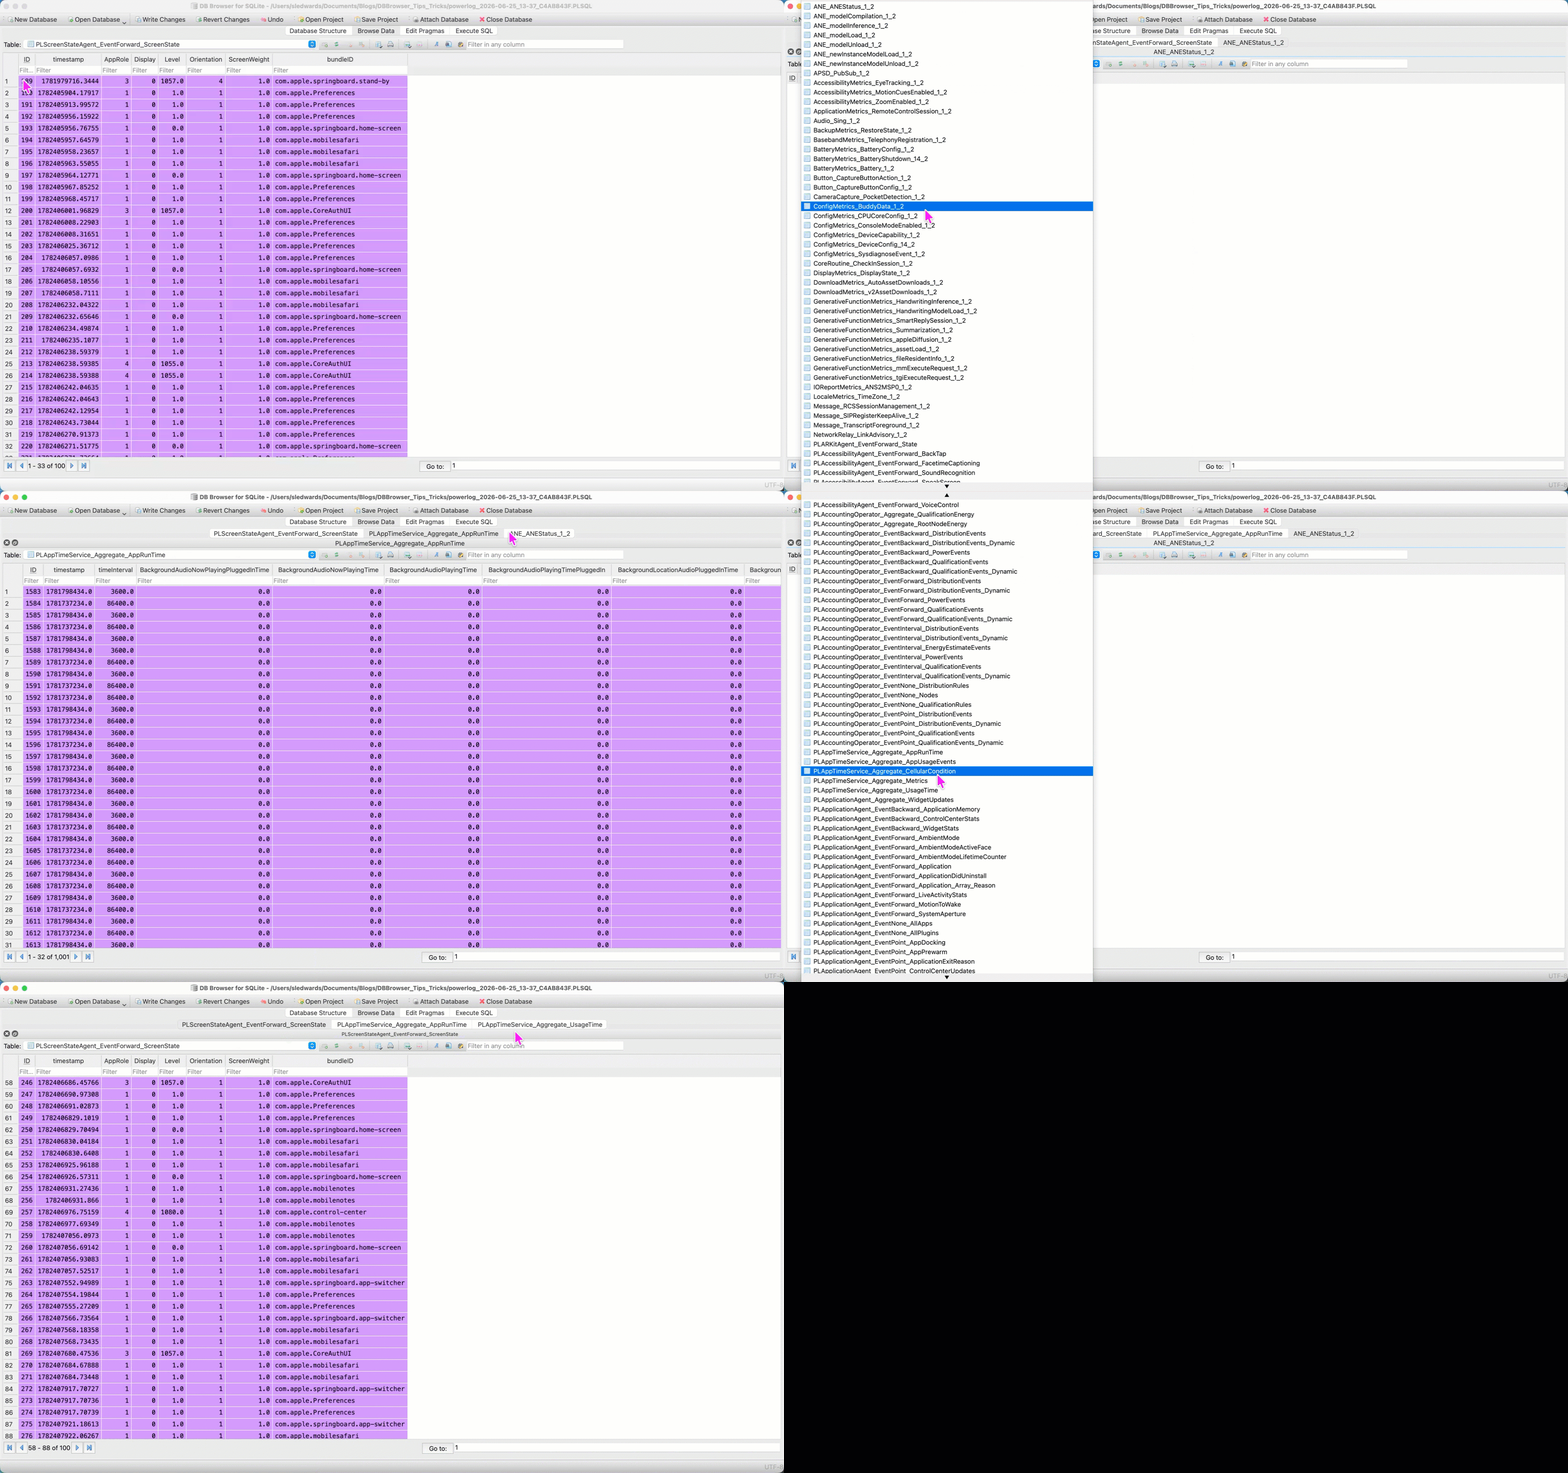
I am often pivoting between powerlog tables, back and forth multiple times to compare certain types of data. I could go back and forth in the table drop down but that potentially makes me lose my spot in each table. This is where a somewhat hidden feature becomes helpful. The context-click, just above Row 1 in the table. This allows me to open multiple Browse Data tables at the same time.
I hope folks out there find these tips and tricks useful in your own analysis, may your database analysis be as quick, efficient, and as painless as possible. Happy Hunting!



Subscribe to our blog to receive the latest research and industry trends delivered straight to your inbox. Our blog content covers sophisticated mobile threats, unpatched vulnerabilities, smishing, and the latest industry news to keep you informed and secure.